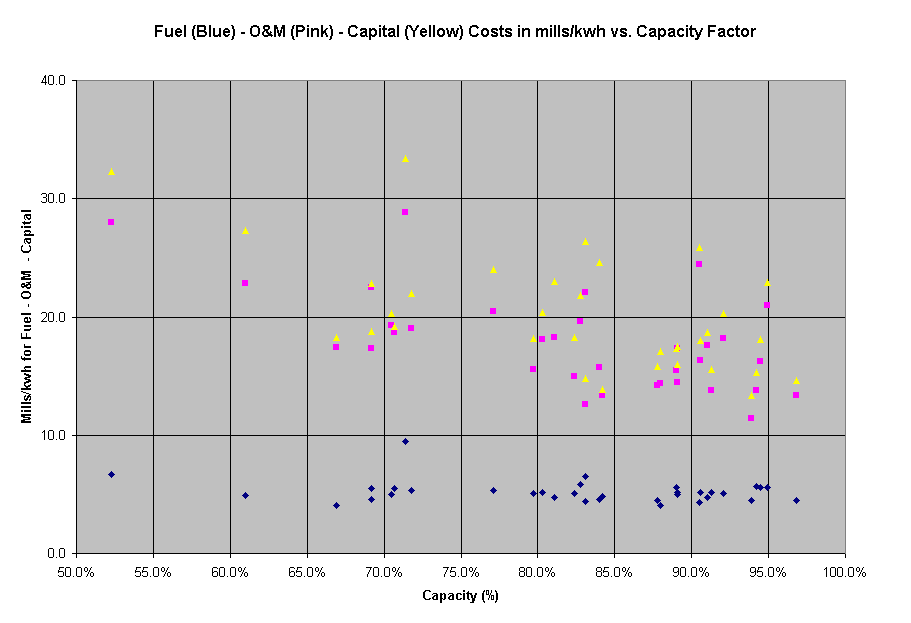
Cost Comparisons for US Plants
The graph below (based on 2000 data) shows that fuel costs (in blue) are relatively independent of the capacity factor. However, for O&M expenses (in pink) and capital costs (in yellow), there general trend is toward higher costs when the capacity factor is lower. In other words, if the plant does not run as much costs will be higher. For good performing plants (with capacity factors greater than 90%), nominally:

Copyright © 1996-2006. The Virtual Nuclear Tourist. All rights reserved. Revised: December 20, 2005.